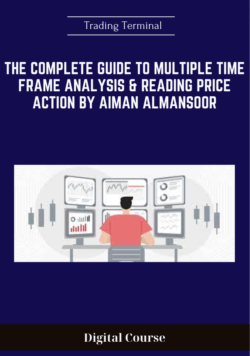
Salepage link: At HERE. Archive: https://archive.is/U1SB9Total sizes: 5.48 GB – include: Buy now $249 $1499, The Complete Guide to Multiple Time Frame Analysis & Reading Price Action by Aiman Almansoor – Trading Terminal Course.This course includes everything one needs to know about reading price action using multiple time frames going from the bigger time frames, for example the weekly chart, all the way down to the 1 minute chart. Reading the price action and analyzing multiple time frames is a skill any day trader is required to have no matter what strategy or indicators they are using. Understanding where the market is headed, and key levels for entries is something one can do by thoroughly analyzing multiple charts and it’s a skill that is usually built through thousands of hours of screen time and practice; However, this course contains everything you might need to decrease the learning curve and get your chart reading skills to the next level.Course contentsModule 1Introduction to Predicting the Next CandleMarket PhasesPredicting a Phase Before it HappensThe Main Daily ScenariosThe Main Rules for Predicting the Next CandleExamples on Predicting Daily Candles on AMDExamples on Predicting Daily Candles on CCLExamples on Predicting Daily Candles on CVXHow to Find the Best Potential RunnersModule 2Going for the Daily Candle vs 60-Minute CandleAnalyzing the 60-Minute Chart and 5-Minute Chart Along with Premarket DataHomework Practicing Breakouts Based on Higher Time FramesEntry Criteria Based on the 5 and 1-Minute ChartsTrend Trading to Scalping Based on Different Time FramesThe Importance of Reading Candlestick OverlapsIntroduction to Dip Buying-Pinpoint StrategyModule 3Finding Key Levels for Day TradingFirst Pinpoint Scenario: 20-200Second Pinpoint Scenario: The Pullback DayThird Pinpoint Scenario: The Continuation DayFourth Pinpoint Scenario: The Day After the Continuation DayFifth Pinpoint: Scenario GappersSixth Pinpoint Scenario: Day After a Huge RunnerSeventh Pinpoint Scenario: Price ActionModule 4Utilizing the Weekly Chart to Build a Watch List for Day TradingUtilizing The Weekly Chart to Find Swing TradesHow to Read Price ActionModule 5How to Play ORBsPart1: Different Methods to Add Into a Winning TradePart 2: Different Methods to Add Into a Winning PositionExamples of Traps That get Retailers Out of Their PositionsIntroduction to Trading Reversals Using Multiple Time Frame Analysis
The Complete Guide to Multiple Time Frame Analysis & Reading Price Action by Aiman Almansoor – Trading Terminal
₹41,334.00


