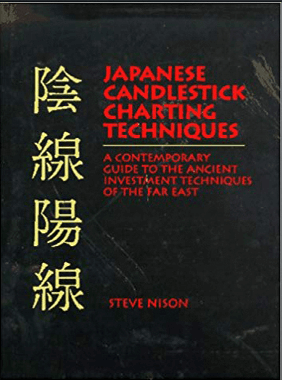
Candle charts are older than bar charts, older than point-and-figure charts, but were completely unknown in the West until Steve Nison introduced them through his articles, seminars, and his books.
Steve Nison – Japanesse Candlestick Charting Techniques
Editorial Reviews
From the Publisher
An exciting and valuable addition to the literature of technical analysis
this ancient Japanese technique is available to American traders in a comprehensive, well-written, and understandable format.
John Murphy, President
JJM Technical Advisors, Inc. and
Author of Technical Analysis of the Financial Markets
Its hard not to be too effusive about the quality of Nisons work
reading [his book] was a pleasure. This is clearly one of the best investment books ever written
. We strongly recommend this book, which has already become an investment classic.
Bruce Babcock, Jr. Editor-in-Chief, Commodity Trades Consumer Report
From the Inside Flap
Charting techniques used by the Japanese for over 100 years are explained for todays traders and investors in:
JAPANESE CANDLESTICK CHARTING TECHNIQUES, SECOND EDITION: A Contemporary Guide to the Ancient Investment Techniques of the Far East
Steve Nison
Completely informative and global in its outlook, Japanese Candlestick Charting Techniques, Second Edition provides an in-depth explanation of candlestick plotting and analysis. This exciting book exposes the reader to the practical applications Steve Nison gained from years of study and research in this now popular and dynamic area. Today, almost all charting packages include candle charts.
Download immediately Steve Nison – Japanesse Candlestick Charting Techniques
This book contains hundreds of examples that show how candlestick techniques can be used in all of todays markets. Through such patterns as the dark-cloud cover and hanging-man lines, traders will discover how candlestick techniques provide unique market insights. They will discover see how candles will provide early reversal signals, improve timing entering and exiting markets and can be merged with classic Western charting techniques.
This totally updated revision focuses on the needs of todays traders and investors with:
* All new charts including more intra-day markets
* New candlestick charting techniques
* More focus on active trading for swing, on-line and day traders
* New Western techniques in combination with candles
* A greater spotlight on capital preservation.
Candle charts are older than bar charts, older than point-and-figure charts, but were completely unknown in the West until Steve Nison introduced them through his articles, seminars, and his books.
Technical Analysis Candlesticks
How to understand about technical analysis: Learn about technical analysis
In finance, technical analysis is an analysis methodology for forecasting the direction of prices through the study of past market data, primarily price and volume.
Behavioral economics and quantitative analysis use many of the same tools of technical analysis, which,
being an aspect of active management, stands in contradiction to much of modern portfolio theory.
The efficacy of both technical and fundamental analysis is disputed by the efficient-market hypothesis, which states that stock market prices are essentially unpredictable.


