

buying should be considered when price makes new low, yet, accumulation/distribution indicator fails to make a new low File size: 83.2 MB
Larry Williams – Accumulation and Distribution
Williams Accumulation /Distribution was created by Larry Williams to measure positive and negative market pressure. It should not be confused with which is completely different indicator developed by Marc Chaikin and based on volume and price data. in technical analysis is used to evaluate – how many shares were accumulated during an up-move (during buying) and how many shares were distributed during a down move (during selling). is based solely on price data and here accumulation/distribution represents sum of positive (accumulation) and negative (distribution) price movements.
Technical Analysis, Signals and Trading Systems
In technical analysis Williams Accumulation /Distribution is used to measure/compare bullish and bearish price pressure. According to Larry Williams theory a technical analysts should look for a divergence between a price and an indicator. He states that:
buying should be considered when price makes new low, yet, accumulation/distribution indicator fails to make a new low;
and selling should be considered when price makes new high, yet, accumulation/distribution indicator fails to make a new highs.
As a rule, when price moves up, WAD moves up – positive price movements are added to this indicator. During price decline, negative price movements are subtracted from WAD and this indicator moves down. However, since Larry Williams uses True High (TRH) and True Low (TRL) in Accumulation/Distribution calculations (see formula below), there could be situation when price makes a new high and WAD does not or price drops to a new Low and WAD fails to do it. To understand better what exactly we have when we are looking for the price/indictor divergence, we have to take a deeper look into the WAD calculations and see what kind of price behavior may lead do a divergence and why we should considered it as a buy/sell opportunity.
On the Chart #1 blow you may see a detailed illustration of a situation when you may witness a negative divergence between price and Accumulation Distribution indicator – when price makes a new high and WAD fails to make a new high. Mathematically, according to the Accumulation/Distribution calculations, this situation is possible when:
after price up-move when price was making new highs, we have a modest correction.
within this correction we had negative bars (bar’s close below pervious close) and these negative bars had strong positive opening (bar’s open above previous close)
then we had strong recovery which makes a new high.
Now, when we look for a negative price/WAD divergence, we may say that we are looking for a correction after up move with specific price behavior: when we have strong positive opening (above previous close) and then decline which lead to negative trading (close before previous close). This suggests that despite positive opening we have steady and strong bearish (selling) pressure which moves price down resulting in negative trading. Because of the strong positive opening, despite strong bearish pressure we have only a shallow correction. If during this shallow correction, we have strong spike of Bullish pressure we may have new high in price and Accumulation distribution will fail to make a new high. Overall, we have a situation when the Bears are quite strong and can generate steady selling pressure. On the other hand, we have strong spikes of the Bullish pressure which causes strong positive opening, yet steady and strong bearish pressure pushes the price down at the end. In this situation, when we have strong recovery with news high, we may assume that this recovery was caused by a strong spike in Bullish pressure and the same as before, at the end, strong and consistent Bearish pressure should push price lower and this could be a good moment to consider selling.
Basically when we see negative divergence between price and accumulation/distribution indicator we witness change in the market behavior – previously steady and strong Bulls with weak Bears turned into strong and steady Bears with strong short-lived spikes of the Bullish pressure.
The Williams’ Accumulation/Distribution indicator is a leading indicator – it predicts future price trend changes. In case of a negative price/indicator divergence it predict future price down-turn while price is making new highs. As with all leading indicators the accumulation/distribution indicator is not always played. Therefore, it could be recommended to wait for a downturn confirmation before making a “sell” trade. However, since a “sell’ is already reconfirmed by WAD indicator, a confirmation of price down-turn my not necessary be very strong.
Chart 1: Situation explained when negative divergence between price and Accumulation/distribution indicator could be witnessed:
Explanation of mechanics behind price/WAD positive divergence are similar to the explanation of mechanics behind negative divergence (see chart #2 below). Basically you are looking for a moment when during down-trend you have a modest bounce up (recovery) when during this recovery you have price bars with negative opening yet positive close (indication of strong and consistent bullish pressure). If after the modest bounce-up we see decline and we see price making new Low and accumulation/distribution fail to make a new low, we have a sign that the bearish pressure is weakling and is not consistent (only spikes of bearish pressure) and the consistent and strengthening pressure of the Bulls may take over and it may reverse the price’s trend up. While this could be a good moment to consider buying, as was mentioning above, it could be a good practice to wait for a confirmation of an up-reversal.
Chart 2: Situation explained when positive divergence between price and Accumulation/distribution indicator could be witnessed:
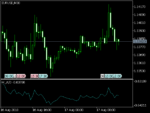
Williams Accumulation-Distribution indicator is popular among intraday traders and intraday scalpers. A simple trading system based on this indicator would apply an Exponential Moving Average (EMA) to WAD indicator as a signals line. An EMA is used to spot changes in a direction of an indicator. Therefore when WAD starts to decline it drops below an EMA applied to it and when WAD line changes its trend from down to up, WAD advances above its EMA. Below you may see an example of a simple trading system based on Williams Accumulation-Distribution indicator and its EMA crossovers:
Consider buying when Williams Accumulation-Distribution Line crosses below its Signals line (EMA applied to WAD),
Consider selling when Williams Accumulation-Distribution Line crosses above its Signals line.
Chart 3: Apple (AAPL) stock chart (1 bar = 1 minute) and Williams Accumulation-Distribution
Directional Williams’ Accumulation/Distribution Formula and Calculations
1. Calculate True High (TRH) and True Low (TRL)
TRH = Current bar high or precious bar close, whatever is higher
TRL = Current bar low or previous close, whatever is lower
2. Calculate current bar Accumulation/Distribution:
if Current close is above previous close then
AD = Current Close – TRL
if current close is below previous close
AD = Current close -TRH
if current close = previous close then
AD = 0
3. Calculate Williams Accumulation Distribution which is calculated as cumulative total sum of AD values
WAD = Previous WAD + AD
Download immediately Larry Williams – Accumulation and Distribution now
Here’s What You’ll Get in Larry Williams – Accumulation and Distribution
Larry Williams – Accumulation and Distribution : Sample