Corporate Finance Institute – Tableau Trading Dashboard
Create a trading dashboard in Tableau based on a real-world scenario – building advanced visuals using techniques like parameter actions and table calculations.
Connect to an enterprise database to ensure a single version of the truth
Solidify your knowledge of core Tableau skills with an in-depth case study
Customize your visuals with filtering, highlighting, parameters, and actions
In this case study, you’ll take on the role of a Business Intelligence Analyst in an investment bank. The Sales and Trading team at CFI Capital Partners need you to develop customized dashboards to help their team with bespoke market analysis.
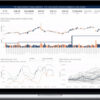
You will be creating candlestick charts, Bollinger bands, market cap tree maps, growth plots, and much more in this exciting real-world scenario.
With plenty of extended student challenges and interactive exercises, this course is the perfect scenario-based case study to reinforce your fundamental knowledge of Tableau.
This course is perfect for anyone who would like to practice their Tableau and SQL skills in a real-world scenario. There is no better way to kick-start a career in data analysis, quantitative analysis, business intelligence, or other areas of finance with applied, practical knowledge of Tableau and related BI tools.
What You’ll Learn In Tableau Trading Dashboard?
This case study is the perfect way to practice your Tableau and BI skills, and will help reinforce five key areas of Tableau:
Creating Advanced Visuals – Candlesticks, Bollinger Bands and more
Parameters – for filtering and highlighting
Order of Operations – The key unlocking your Tableau superpowers
Table Calculations – for moving averages and rolling maximums
Parameter Actions – for next-level dashboard interactivity