Wyck Analytics – Point and Figure from Stocks to Cryptos
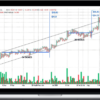
Point-and-Figure (P&F) charting is one of the pillars of the Wyck Methodology. Generations of traders have calculated price targets using Wyck’s horizontal counting approach.
In this new series, Bruce Fraser and Alessio Rutigliano will illustrate how to apply this time-tested technique to stocks and cryptocurrencies.
The course includes case studies from both the stock and crypto universe (Indexes, high momentum stocks, Bitcoin, and the altcoin market).
What You’ll Learn In Point and Figure from Stocks to Cryptos?
Charting tools and settings for Point-and-Figure Charts
Basic examples of Point-and-Figure charts in the Stock market
Crypto and high volatility instruments
Percentage Scaling
Ethereum: a case study
Point-and-Figure applied to Crypto Indexes
Point-and-Figure Price Targets for Swing Trading