What you’ll learnLearn Advantages of Point & Figure Chart in Stock TradingLearn Point & Figure Chart Patterns like Breakout of Symmetrical triangle Chart Pattern & Others for trading stocks (Based on P&F)Learn Point & Figure Charts through Stock Trading Case studies like Coca Cola, Bank of America, Pepsi Co. ChartsLearn Breakout of Descending Triangle Chart Patterns based on Stock Trading & P&F ChartsA simple trick to know your odds of success in Stock TradingUse little-known techniques to greatly reduce Stock Trading risk and maximize profitsPoint & Figure Chart is a Top Chart in Technical AnalysisPoint & Figure Chart is an import part in getting Technical Analysis CertificationMaster Technical Analysis most lethal chartRequirementsNo prior trading experience is necessaryYou will need a practice Trading AccountOpen Mind and not judging the Strategy from past learningYou commit that after the course you will do demo trading on this strategy for at-least 6 Months.*** Course access includes quizzes & homework exercises, 1-on-1 instructor support with LIFETIME access! ***Hear why this is one of the TOP-NOTCH Stock Trading & Chart Pattern Course on Udemy:Yes this is a good match, because I want to understand Point and Figure Charts better.-Reginald ClintonSaad is excellent at keeping things simple while exploring a complex topic.-Deran SilvaTOP-NOTCH Stock Trading & Chart Pattern InstructorI currently have 70 Courses with 20,280+ Minutes of Content (338 hours in total) with 100,000+ Satisfied Students enrolled. That’s 14+ days of learning material!Stock Trading & Chart Pattern Course Details:Point & Figure Chart is a chart used for Following Price Trends and to make decisions According to long term trends. Point & Figure Charts differs from traditional Stock Trading charts Example Candlestick chart as Point & Figure Chart doesn’t consider time in Analyzing Trends.Point & Figure Chart Patterns were invented in the late 19th century & have worked since then. Point & Figure Chart Patterns trading is time tested and have always worked in Stock Trading.Point & Figure Chart never misses a Change in Trend & Therefore it is one of the best kept Stock Trading secret.Therefore this is your chance to learn a new Skill in Stock Trading. As Point & Figure Chart Pattern is a skill not to be missed.Point and figure (P&F) is a charting technique used by experienced Stock Investors. Point and figure charting does not plot price against time, Instead it plots price against changes in Trend.Make Stock Market your darling and you will never see losses.This course will teach you How Stock Trading Works & How to become a stock trading expert.Disclaimer Note: This Stock Trading & Chart Pattern course is for educational and informational purposes only. Not recommending of any particular investments such as a particular stock or mutual fund.Learn Advance Point & Figure Charts for Stock Trading. Advance P&F Chart Pattern are also included (Technical Analysis).Who this course is for:Anyone interested in earning an extra income from homeYou should not take this course if you aren’t willing to dedicate some time and discipline to learning the strategyGet Certification in Point & Figure chart & P&F Chart Patterns – Udemy , Only Price $27Tag: Certification in Point & Figure chart & P&F Chart Patterns – Udemy Review. Certification in Point & Figure chart & P&F Chart Patterns – Udemy download. Certification in Point & Figure chart & P&F Chart Patterns – Udemy discount.

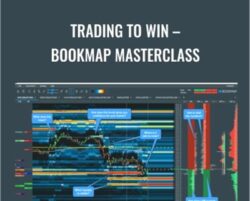 Trading To Win – Bookmap Masterclass
₹12,118.00
Trading To Win – Bookmap Masterclass
₹12,118.00
 From 0 Idea to 7 Figures Acquisition – Jason Paul Rogers
₹7,968.00
From 0 Idea to 7 Figures Acquisition – Jason Paul Rogers
₹7,968.00
Certification in Point & Figure chart & P&F Chart Patterns – Udemy
₹3,818.00
Certification in Point & Figure chart & P&F Chart Patterns – Udemy
₹3,818.00