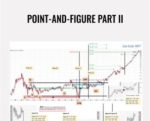
Among Richard Wyckoff’s many contributions to technical analysis is his unique method of estimating price targets using his Second Law of “Cause and Effect,” in which the horizontal Point and Figure (P&F) count in any trading range represents the Cause and the subsequent trending price movement the Effect. Like many other phenomena in trading, Wyckoff’s Second Law is fractal, and can be profitably deployed in any time frame. In P&F Part II, Bruce Fraser and Roman Bogomazov provide detailed instructions on how to:Create and annotate Wyckoff-style P&F chartsCorrectly identify the count line in a variety of trading range configurationsDesignate P&F phases sequentially and project price targets from eachAnticipate the resumption of a trend based on confirming counts of re-accumulation and re-distribution trading rangesManage trades once price approaches P&F-based price targetsCheck the drop-down menu for BUNDLED COURSES!Each of the videos has accompanying slides, which can be printed out to allow you to take notes on as you watch the presentations. You will have one full year from the date of purchase to view and review the videos!Bruce Fraser and Roman Bogomazov provide detailed instructions on how to create and use Wyckoff-based point-and-figure charts to estimate realistic price targets.Targeting across multiple time framesThis course builds on the methodological foundations presented in our on-demand P&F Part I: Setting Price Targets Using Wyckoff Point-and-Figure Projections. However, Part II is based on entirely new material. Bruce and Roman present several of their advanced refinements of this technique, including some that they have never made public before. Traders who purchased Part I will gain new practical insights as well as a much deeper understanding of this approach.Get Point-And-Figure Part II – Wyckoff Analytics, Only Price $67Each of the three sessions in Part II is devoted to a specific time frame:Long-term campaigns [months to years]Swing trades [weeks to months], andIntraday [hours to days]Step-by-step process for horizontal countsBruce and Roman present the materials as case studies that start with a blank P&F chart and then, as the chart unfolds over time, show you their step-by-step process for taking and projecting horizontal counts.In this webinar series, they demonstrate — for the first time — how to analyze the directional bias of a trading range based on P&F analysis alone, as well as how to enhance the quality of your P&F analysis by incorporating trading volume. They introduce new concepts through the case studies, and revisit the fundamentals of P&F horizontal counting.Get Point-And-Figure Part II – Wyckoff Analytics, Only Price $67Tag: Point-And-Figure Part II – Wyckoff Analytics Review. Point-And-Figure Part II – Wyckoff Analytics download. Point-And-Figure Part II – Wyckoff Analytics discount.

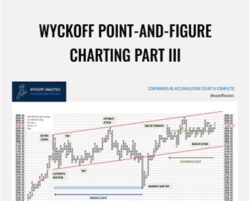 Wyckoff Point-And-Figure Charting Part III – Wyckoff Analytics
₹19,422.00
Wyckoff Point-And-Figure Charting Part III – Wyckoff Analytics
₹19,422.00
 Trading the Crypto Market with the Wyckoff Method – Wyckoff Analytics
₹12,782.00
Trading the Crypto Market with the Wyckoff Method – Wyckoff Analytics
₹12,782.00
Point-And-Figure Part II – Wyckoff Analytics
₹10,458.00
Point-And-Figure Part II – Wyckoff Analytics
₹10,458.00